A Non-Parametric Linear Regression: Theil's Incomplete Method
TheoryWhenever the commonly used least-squares regression method is used for fitting an equation into a set of (x,y)-data points, all errors in the y-direction are normally distributed (i.e. the follow a gaussian distribution). Non-parametric (or distribution-free) statistical methods are those, which make no assumptions about the population distribution from which the data are taken. A simple, non-parametric approach to fit a straight line to a set of (x,y)-points is the 'Theil's incomplete method', so called to distinguish this approach from another more complex procedure (the 'complete method') developed by the same author. Theil's 'Incomplete method' assumes that points (x1, y1), (x2, y2) . . . (xN, yN) are described by the equation y = a + bx The calculation of a and b takes place as follows: 1st step: All N data points are ranked in ascending order of x-values. 2nd step: The
data are separated into two equal size (m) groups, the low (L) and the high (H)
group. If N is odd the middle data point is not included to either group (hence: N = 2m or N = 2m+1). 3rd step:
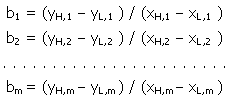
The slope bi of the line connecting the i-th point of group L
with i-th point of group H is calculated for all points of each group, i.e.
4th step: The median of the m slope values b1, b2, . . . bm is calculated and it is taken as the best estimate of the slope (b) of the line, i.e. b = median(b1, b2, . . . bm). 5th step:
For each data point (xi,yi) the value of intercept
ai is calculated using the previously calculated slope b, i.e.
6th step: The median of the N intercept values a1, a2, . . . aN is calculated and it is taken as the best estimate of the intercept (a) of the line, i.e. a = median(a1, a2, . . . aN). The method described for the estimation of a and b has the following distinct advantages over the commonly used least-squares linear regression: (i) It does not assume that all the errors are only in the y-direction. (ii) It does not assume that either the x- or y-direction errors are normally distributed (i.e. it is a typical non-parametric method). (iii) It is not affected by the presence of outlying data points (i.e. it is a 'robust method''). The main disadvantage of the described non-parametric method is its algorithmic nature, i.e. no specific equations are provided for the direct calculation of a and b, as in the case of least-squares regression [see Applet: Least-Squares Polynomial Approximation]. Instead, specific and repetitive steps must be made, a fact that makes manual calculations tedious. The use of a computer program (e.g. a spreadsheet) is necessary, particularly when many (x, y)-data points are involved.
Applet This applet demonstrates the Theil's non-parametric method of fitting the equation y = a + bx to manually introduced (x, y)-data points and provides a visual comparison with the corresponding least-squares method. Simply, the user must left-click N (4≤N≤200) data points on the plot area. The corresponding lines (green for the non-parametric regression, red for the least squares regression) appear soon after 4 data points have been clicked. The corresponding (for each approach) estimated slope (b) and intercept values (a) are shown in the corresponding (for each method) text fields.
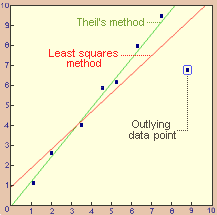
One can test the robustness of the non-parametric regression, by clicking outlying data points. In the figure above is shown a typical plot, where one outlying data point makes the least-squares line to pass closer to it, whereas the non-parametric method seems like ignoring its presence.
Literature: J.C. Miller and J. N. Miller,
"Statistics for Analytical Chemistry", Ellis Horwood PTR Prentice
Hall, Analytical Chemistry Series, 3rd ed. (1993), pp 159-161
|


