|
Distribution Diagrams of Polyprotic Acids
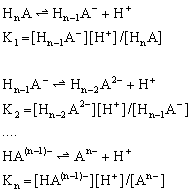
Theory Polyprotic (polybasic) acids dissociate in multiple steps which are characterized by the consecutive dissociation constants K1, K2, ..Kn (it is always: K1>K2, …>Kn). Therefore, for the n-protic acid HnA we have:
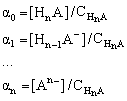
The following fractions of the total concentration of acid species are defined:
where
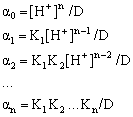
By combining all these equations the following set of equations is obtained, which describe these fractions as functions of [H+], also known as alpha-functions:
where
Applet With this applet you can easily draw the distribution diagrams, i.e. the plots of the aforementioned fractions as a function of pH. You can select the type of the acid (monoprotic, diprotic, triprotic, tetraprotic) and enter the consecutive dissociation constants K at the corresponding edit boxes as pK values (pK = -logK). Click 'DRAW' to obtain the plots. The applet starts with a set of default pK values for each acid type corresponding to: acetic acid (pK1=4.74), hydrogen sulfide (pK1=7.00, pK2=14.00), phosphoric acid (pK1=2.12, pK2=7.21, pK3=12.0) and H4-EDTA (pK1=1.99, pK2=2.67, pK3=6.16, pK4=10.26). From these diagrams you can easily judge about the prevailing acid species (undissociated acid or any acid anion) at any pH range. It is of interest to note that in many cases an intermediate acid anion can never be found -practically- alone at any pH range (e.g. see the EDTA distribution diagram, or try the tartaric acid distribution diagram, pK1=2.96, pK2=4.16).
|


